Preface: Explaining our market timing models
We maintain several market timing models, each with differing time horizons. The "
Ultimate Market Timing Model" is a long-term market timing model based on the research outlined in our post,
Building the ultimate market timing model. This model tends to generate only a handful of signals each decade.
The
Trend Model is an asset allocation model which applies trend following principles based on the inputs of global stock and commodity price. This model has a shorter time horizon and tends to turn over about 4-6 times a year. In essence, it seeks to answer the question, "Is the trend in the global economy expansion (bullish) or contraction (bearish)?"
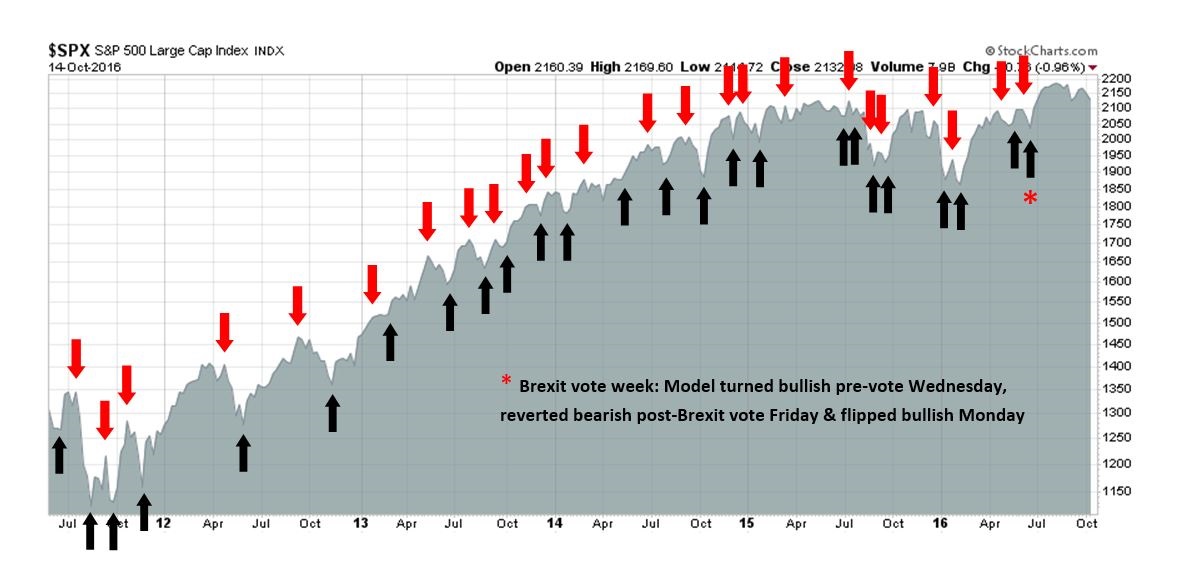
My inner trader uses the
trading component of the Trend Model to look for changes in direction of the main Trend Model signal. A bullish Trend Model signal that gets less bullish is a trading "sell" signal. Conversely, a bearish Trend Model signal that gets less bearish is a trading "buy" signal. The history of actual out-of-sample (not backtested) signals of the trading model are shown by the arrows in the chart below. Past trading of the trading model has shown turnover rates of about 200% per month.
The latest signals of each model are as follows:
- Ultimate market timing model: Buy equities*
- Trend Model signal: Risk-on*
- Trading model: Bullish*
The performance chart and model readings have been delayed by a week out of respect to our paying subscribers.
Update schedule: I generally update model readings on my
site on weekends and tweet any changes during the week at @humblestudent. Subscribers will also receive email notices of any changes in my trading portfolio.
It's always something: Deutsche Bank edition
Readers of a certain age will recall the immortal line of late Gilda Radner as "Rosanna Rosanna Dana" in
Saturday Night Live, "It's always something!"
Two weeks ago, the market was worried about the uncertainties posed by presidential debate. Last week, it was Deutsche Bank. This week, my market commentary will focus mainly on a tail-risk scenario of a Deutsche Bank sparking a European banking crisis.
To recap, the markets got spooked by continuing concerns over the financial health of Deutsche Bank (DB). The worries sparked a number of comparisons with the failure of Lehman Brothers, which sparked the Great Financial Crisis of 2008 (chart via
Zero Hedge).
If you are still worried about DB, then consider the following: If Europe didn't allow the Greek banks to topple during the last couple of Greek financial crises, would it allow a systemically important bank like DB to fail? If you accept the Deutsche as Lehman analogy, then what would that make Greek banks?
The full post can be found at our new site
here.